What are GHG emissions
Greenhouse gases are gases in Earth’s atmosphere that trap heat. They let sunlight pass through the atmosphere, but they prevent the heat that the sunlight brings from leaving the atmosphere. Refer to What are Greenhouse gases for the details.
Ways to slice & dice
There are different ways to breakdown the global GHG emissions. Just to mention a few:
- By country
- By sector
- By societal needs
- Household contributions
Emissions by Country
There are multiple ways to look at GHG emissions for countries. Some statistics show the emission per capita, other show the total emission for the whole country. The Aqal group uses a so called Varidewide chart to show both in one graph.
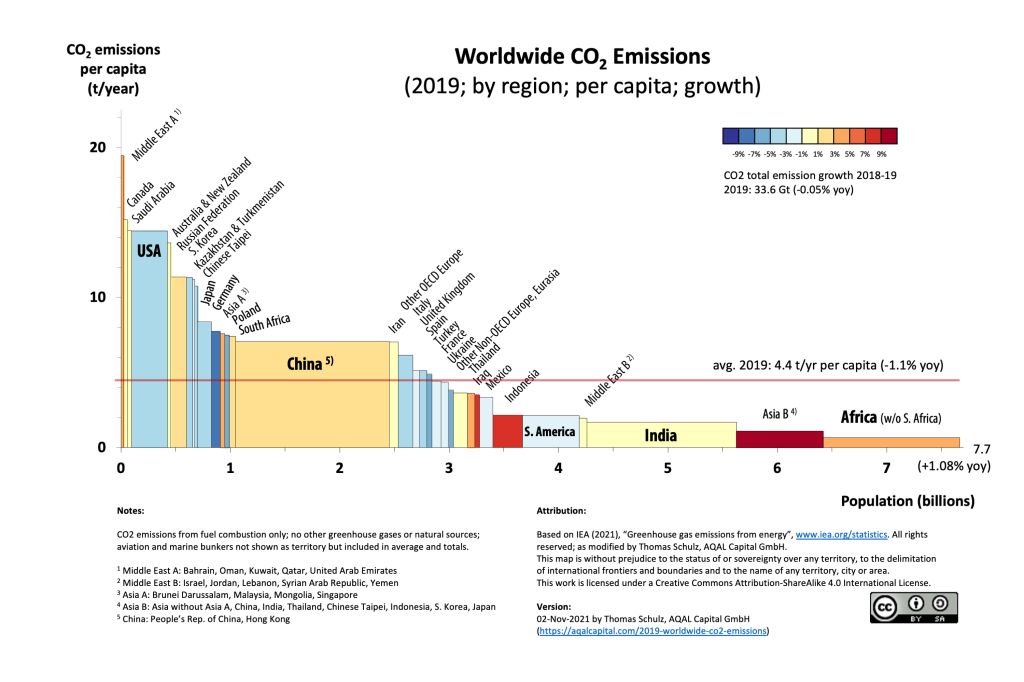
It shows that USA and China are major contributors. USA driven by a high emission per capita, China driven by a large numeber of people.
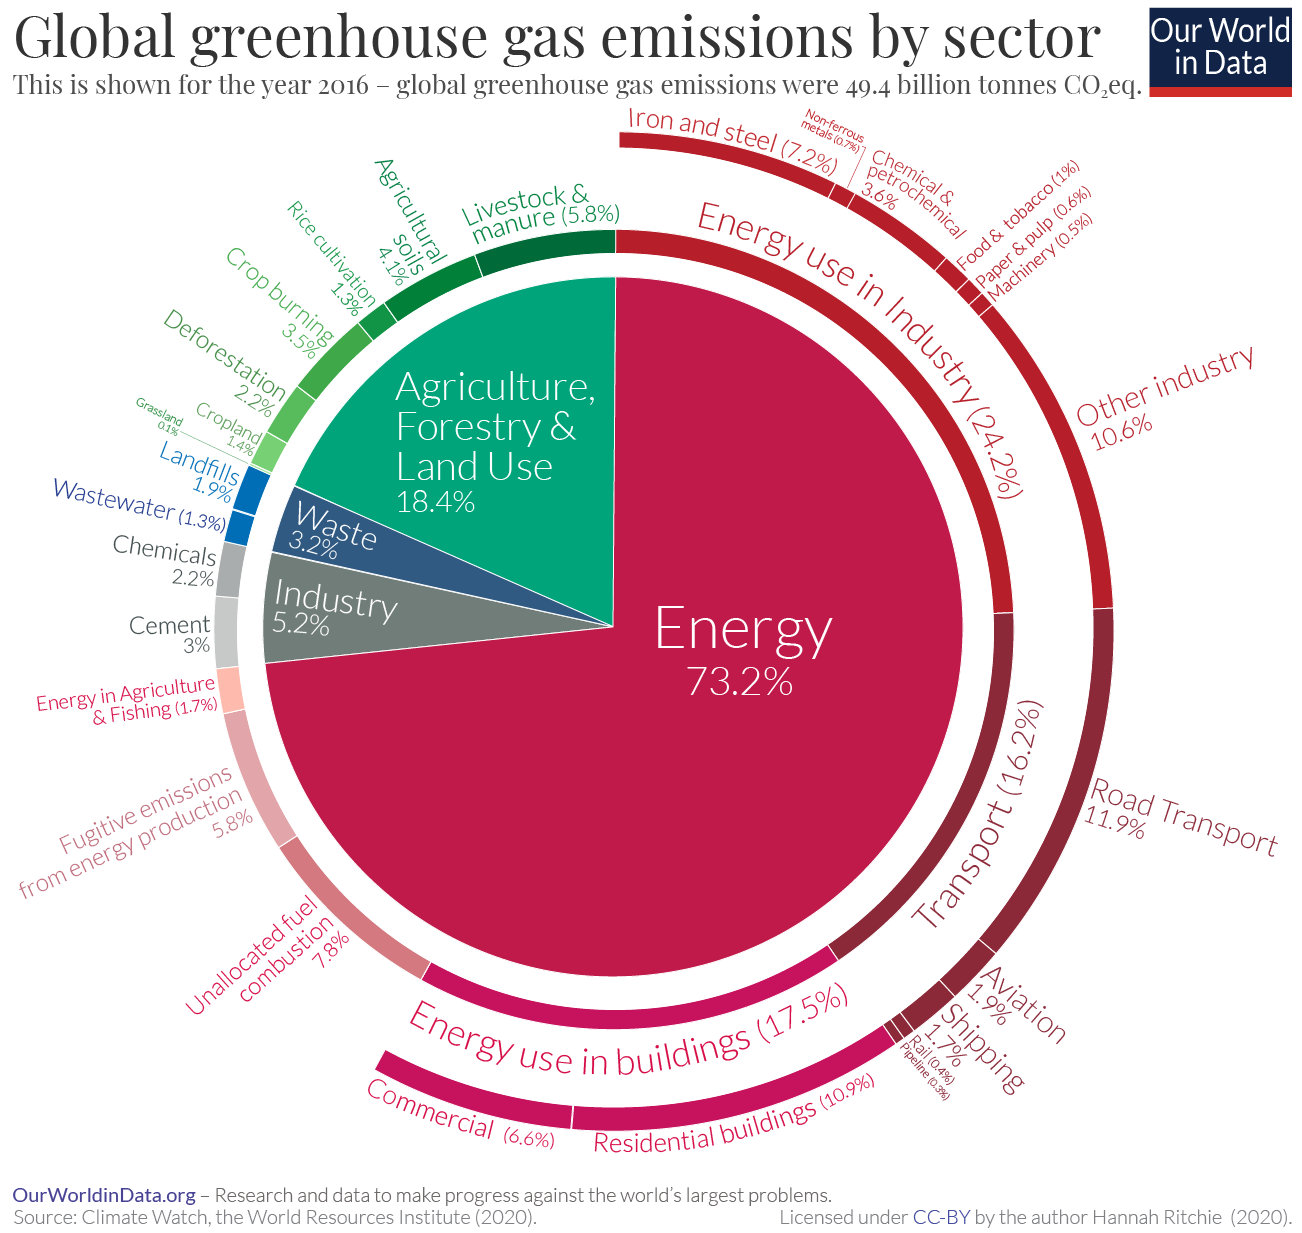
Emissions by Sector
Our World in Data is a great source of data for all kinds of topics.
Emsissions by societal needs
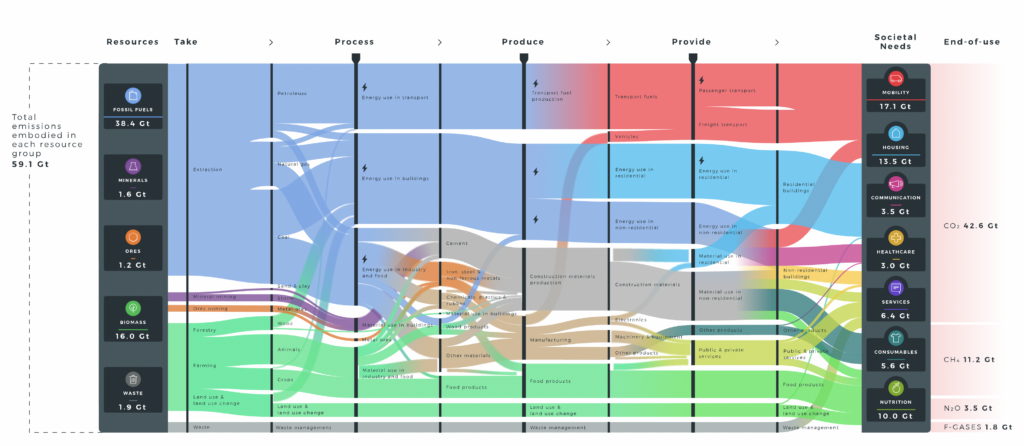
Emissions x-ray by Circularity Gap
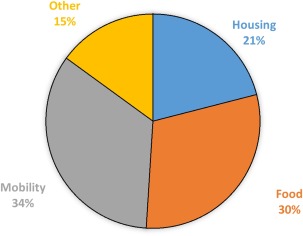
Emissions by households
Household consumption contributes to 72% of global greenhouse gas emissions
It Starts at home? Energy Research & Social Science Volume 52, June 2019, Pages 144-158
The baseline carbon footprint (CF) assessments of households participating in the HOPE study found the mobility sector to be the most significant contributor to a median household’s footprint. Emissions of greenhouse gases were accounted for by CO2 equivalents (CO2e).
Our blog posts / Critical reviews
- Danmarks forbrugsbaserede klimaaftryk er faldet med 25 pctHvad vi har læst Klima-, Energi- ofg Forsyningsminesteriet følger op de danskernes klimaaftryk. For nyligt har ...
- COP26 is a fragile win, is it really?What we have read On the UKCOP26 website, we can read the concluding statement from the ...
- A record year: Wind and solar supplied more than half of Denmark’s electricity in 2020What we have read As the focus on Green House Gas emissions increases, articles claiming significant ...
Must read articles / must see videos
- Climate change 2022: The physical science basisIPCC Working Group 1 report is a code red for humanity. The alarm bells are ...
- Fulfilling the Promise: How Climate Action 100+ Investor-Signatories Can Mitigate Systemic Climate RiskWhat we have read Majority Action is a non-profit, non-partisan organization that empowers shareholders to hold ...
- Breaking boundaries on NetflixThe 75-minute production from 2021 follows the scientific journey of Johan Rockström and his team’s ...
- Regenerative leadershipAuthor and entrepreneur Laura Storm is part of a new generation of sustainability professionals advocating for a ...
- Let the environment guide our developmentThis TED talk is a must see. Even though it is a bit dated, the ...
- A healthy economy should be designed to thrive, not growBrilliant talk on holistic sustainability. What would a sustainable, universally beneficial economy look like? “Like a ...
Knowledge base
- Så meget udleder der forskellige fødevarer
- Carbon budgetsIn order to stay below the 1,5 degrees Celsius, we need to stay within a ...
- Setting meaningful targets: SBTiAt its core, the SBTi framework is a rigorous set of criteria about what emissions ...
- Risks from temperature rises according to IPCC
- Climate change consequences according to ECClimate change affects all regions around the world. Polar ice shields are melting and the ...
- IPCC – The 6th assessment reportThe Working Group I contribution to the Sixth Assessment Report is the most up-to-date physical ...
- Regenerative leadershipAuthor and entrepreneur Laura Storm is part of a new generation of sustainability professionals advocating for a ...
- Let the environment guide our developmentThis TED talk is a must see. Even though it is a bit dated, the ...
- CO2 emissions per personSo, which country uses most CO2, USA or China. The correct answer is: BOTH. How ...
- Our world in dataOur World in Data is a scientific online publication that focuses on large global problems such as poverty, disease, hunger, climate change, war, existential risks, ...